In my last post, I told you about a Quaker ambulance driver who tried to forecast the weather with a pencil and a pile of hay. Lewis Fry Richardson’s magnificent failure, his vindication, and his vision of 64,000 human computers.
But I left something out.
There is a number named after him. A single, dimensionless number that every pilot on every commercial flight depends on whether they know it or not. A number that predicts turbulence - not just in the atmosphere, but, Richardson believed, in human civilization itself.
This is the story of the Richardson number. And it starts with whirls.
Big Whirls Have Little Whirls
Richardson spent his career watching air move. Not casually - obsessively. He measured smoke from chimneys, tracked dandelion seeds, observed clouds tearing themselves apart. He wanted to understand why the atmosphere behaved the way it did - sometimes smooth, sometimes violent.
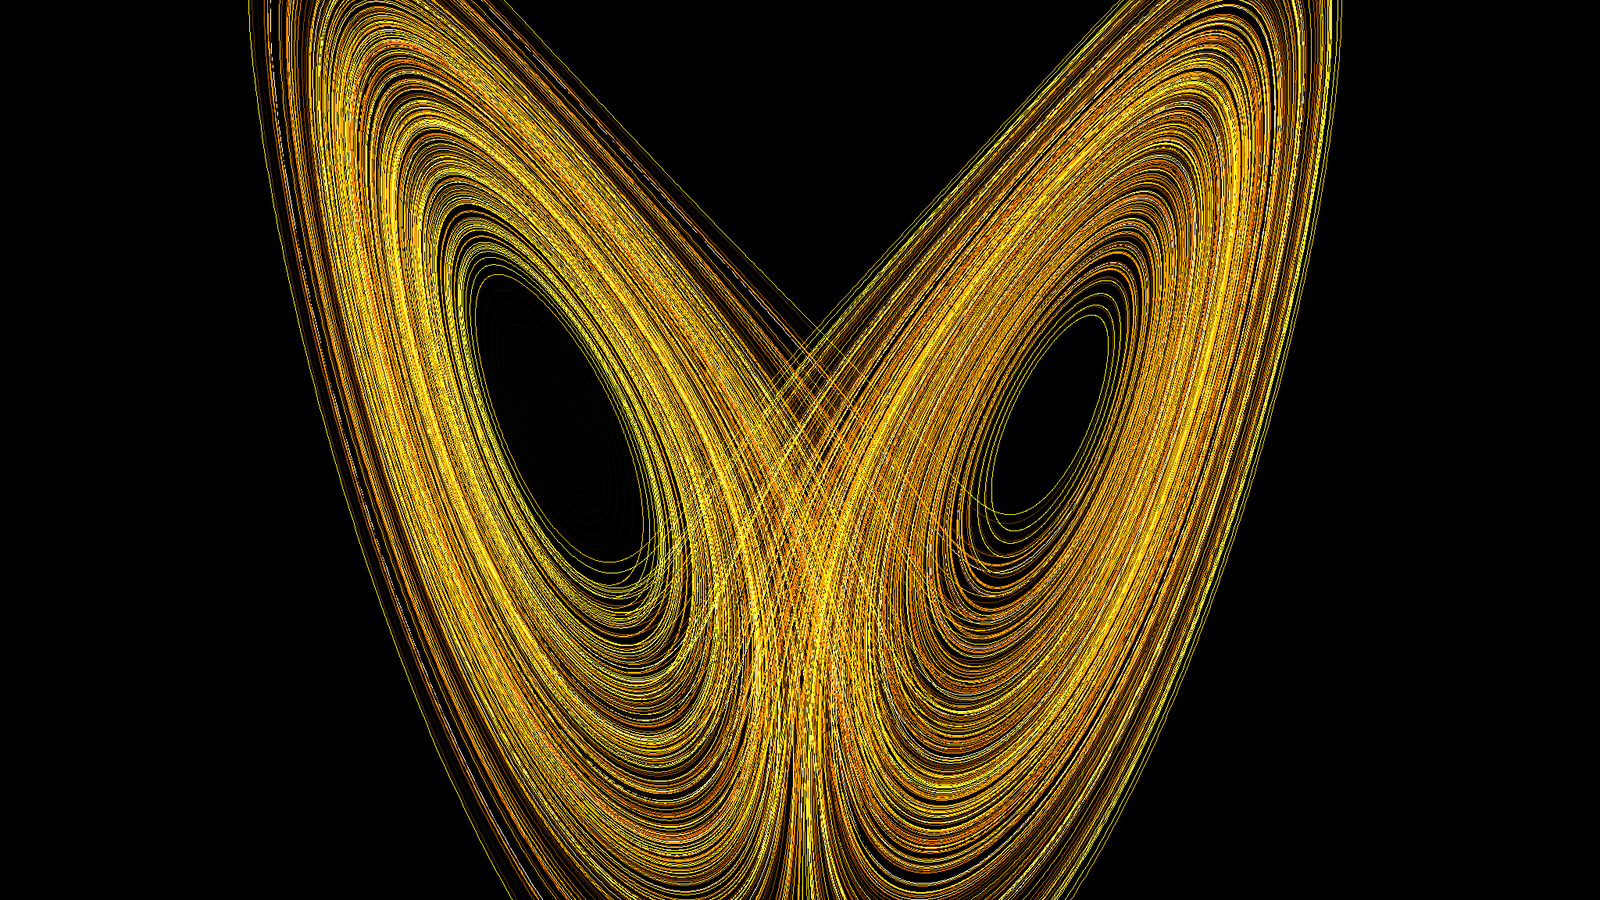
What he noticed was a pattern. Turbulence doesn’t just happen at one scale. It cascades. A massive atmospheric disturbance breaks into smaller eddies, which break into smaller eddies still, passing energy down the chain until - at the very bottom - friction between individual molecules absorbs what is left.
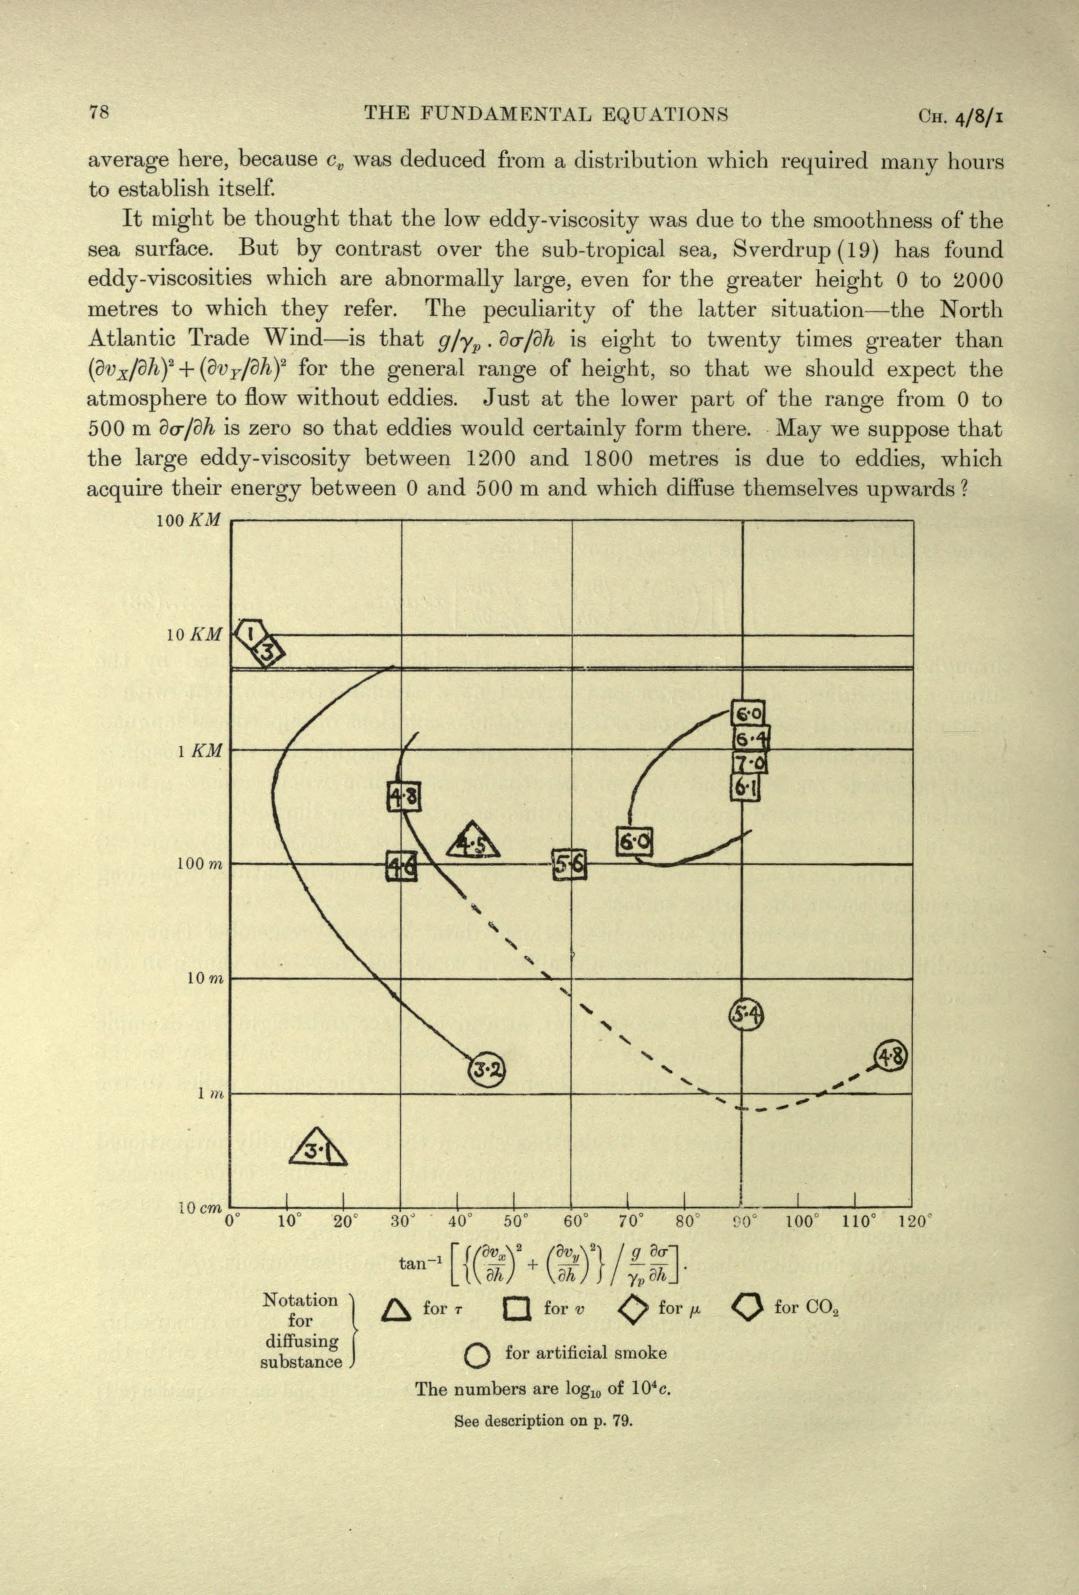
He captured this in what might be the most elegant piece of scientific verse ever written. In his 1922 book Weather Prediction by Numerical Process, he reworked Augustus De Morgan’s poem about fleas - itself a riff on Jonathan Swift - into four lines of scientific prophecy:
“Big whirls have little whirls that feed on their velocity, and little whirls have lesser whirls, and so on to viscosity.”1
It reads like a nursery rhyme. It describes one of the most fundamental processes in physics. The turbulent cascade - energy flowing from large scales to small scales - is the foundation of modern fluid dynamics. Andrey Kolmogorov would formalize it mathematically in the 1940s, but Richardson had seen it first, through the smoke and the dandelions (Vulpiani, 2014).
The Ratio: Heat vs. Wind
But seeing turbulence is one thing. Predicting it is another.
Richardson had noticed something specific during his observations at Eskdalemuir Observatory in Scotland, that bleak and remote place he described as a land of “bleak and humid solitude.”2 Wind fluctuations at different heights seemed to depend on two competing forces:
Force 1: Temperature. When the ground is warm and the air above is cold, the atmosphere is unstable. Warm air rises, cold air sinks, everything churns. Buoyancy wants to create turbulence.
Force 2: Wind shear. When wind speeds differ sharply between heights - fast above, slow below, or vice versa - the layers of air try to tear each other apart. Shear wants to create turbulence.
But here is the thing. They don’t always agree. Sometimes the temperature profile is stable - warm air sitting on top of cold air, like a lid on a pot. In that case, buoyancy is fighting against turbulence, trying to keep things calm. And wind shear is fighting for it, trying to rip things apart.
Richardson’s insight was this: turbulence is a contest between heat and wind. And you can express the outcome as a single number - a ratio (Richardson, 1920):
Ri = (buoyancy suppression) / (shear generation)
That is the Richardson number. It tells you who is winning.
0.25: The Magic Threshold
In 1920, Richardson published this in Proceedings of the Royal Society of London in a paper titled “The Supply of Energy from and to Atmospheric Eddies” (Richardson, 1920). He had extended Osborne Reynolds’ earlier work on turbulence to account for the gravitational effects of a heated atmosphere.
The key result - confirmed independently by Miles (1961) and Howard (1961) decades later - comes down to a single threshold:
- Ri > 0.25 - Stability wins. Buoyancy suppresses the shear. The atmosphere stays calm. Smooth ride.
- Ri < 0.25 - Shear wins. The atmosphere tears itself apart. Turbulence.
That is it. One number. One threshold. It doesn’t matter whether you are looking at a kitchen pot, a jet stream over the Atlantic, or a deep ocean current. Below 0.25, things get violent.
The beauty of it is that Ri is dimensionless. It has no units. It works at every scale - from eddies the size of a city block to currents spanning an entire ocean basin. This is a property Richardson would keep finding, over and over again, in systems far beyond the atmosphere.
The Number in Your Next Flight
You have almost certainly experienced the Richardson number at work, even if you didn’t know it.
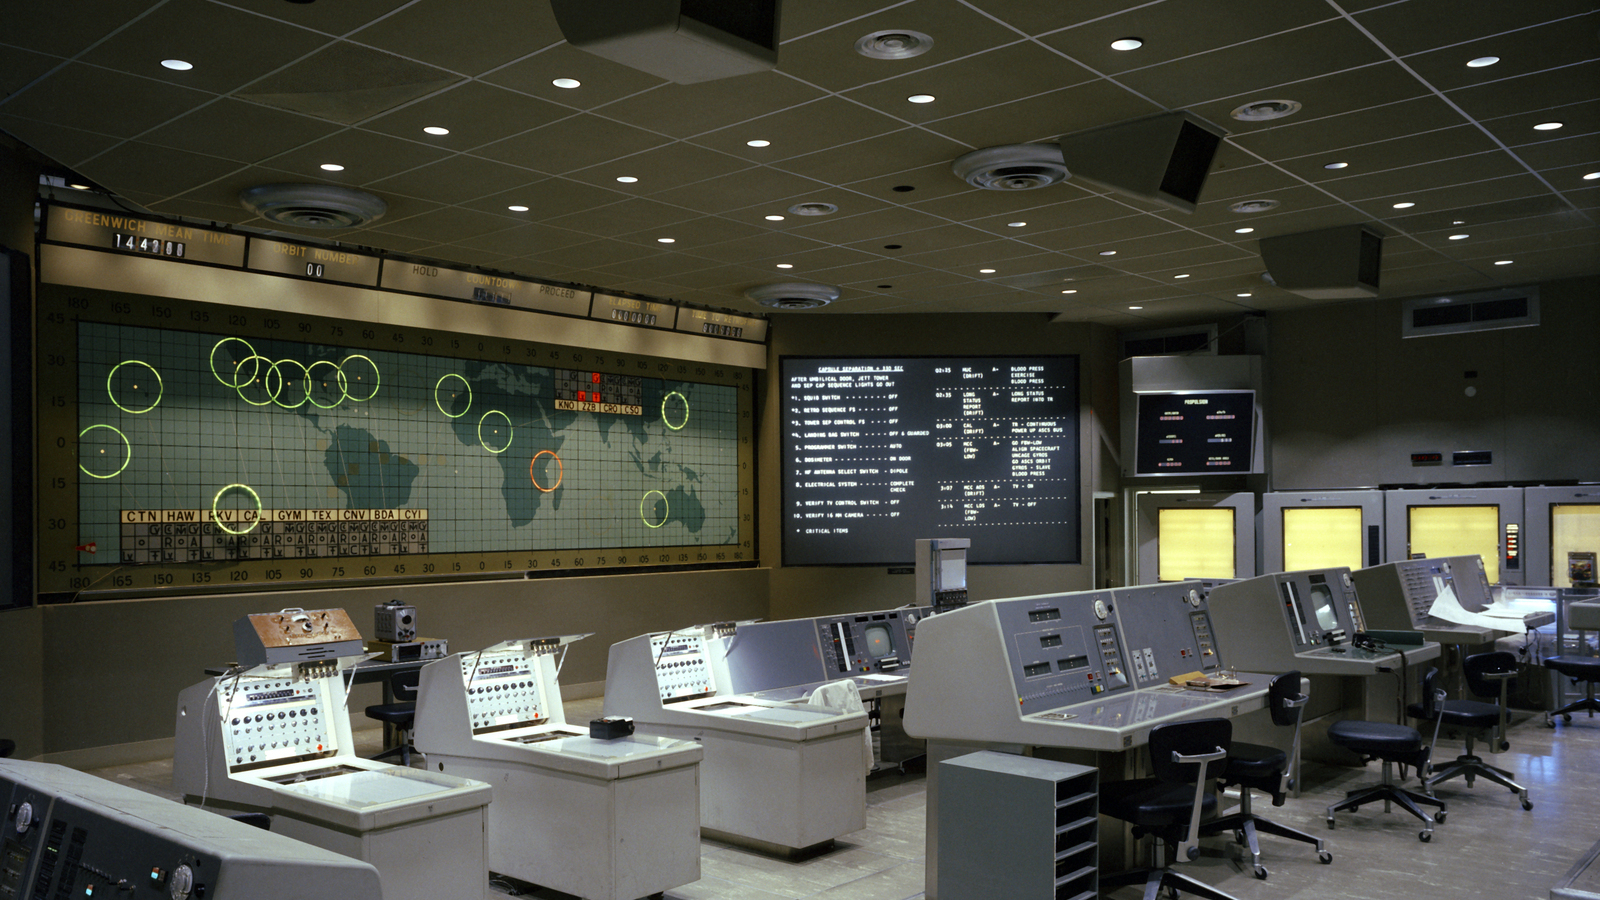
Every time you fly commercial, the pilot gets a turbulence forecast. One of the core tools behind that forecast is the Graphical Turbulence Guidance system, maintained by the NOAA Aviation Weather Center. The Richardson number is baked into it.
Clear Air Turbulence (CAT) - the kind that hits you with no warning, no clouds, no visible sign - happens most often near jet streams, where extreme wind shear meets the stratified upper atmosphere. The Richardson number spikes low in those regions. Below 0.25, the forecast says: turbulence likely.
Before we understood this, CAT was a mystery. Planes hit invisible walls of violent air at cruise altitude. People got hurt. The physics Richardson worked out on a Scottish hillside in 1920 is now part of the infrastructure that keeps you safe at 35,000 feet.
Not bad for a man who measured wind with dandelion seeds.
From Whirls of Air to Whirls of War
Now here is where the story turns.
By the mid-1920s, Richardson’s turbulence work was recognized. His weather forecasting method was still considered a failure (it would take computers to prove him right). But the turbulence research - the Richardson number, the eddy diffusion theory, the cascade - was getting attention.
And then Richardson discovered that his work on atmospheric diffusion - understanding how substances spread in turbulent air - was attracting the attention of people who wanted to know how poison gas would spread across a battlefield.
Richardson was a Quaker. A pacifist. A man who had driven ambulances through the mud of the Western Front rather than carry a rifle.
As Giles Foden wrote in Turbulence, his novel inspired by Richardson’s life, Richardson’s equation “dramatizes the relationship between wind and heat.”3 But for Richardson, the horror was that the same equation could dramatize the relationship between wind and death.
Think about what that means for a moment.
Richardson had been in the trenches. He had driven ambulances through artillery bombardments, carried bleeding soldiers down roads cratered by shells. He had watched men choking on gas, clawing at their throats, drowning in their own lungs. One of his adopted children would later recall Richardson screaming in terror at sudden loud noises years after the war, and explaining that he had “shell shock” - what we now call PTSD.3
This was not a man who had studied war from a library. He had smelled it.
And now his own mathematics - his elegant theory of how particles diffuse through turbulent air - was being picked up by people whose job was to calculate how efficiently poison gas would blanket a trench full of men just like the ones he had carried to hospital.
Richardson’s response was absolute.
He destroyed his unpublished findings on atmospheric diffusion. Burned them. Not shelved, not classified, not handed off to someone else. Destroyed. He then resigned from the Meteorological Office in 1920, when it was absorbed into the Air Ministry - the military branch that controlled the Royal Air Force. As he wrote to the Norwegian meteorologist Vilhelm Bjerknes: “I do not like preparations for war”.4 Yes, that Bjerknes - the same man whose published observations Richardson used for his 1910 forecast on the pile of hay, and the father of the Bergen School of Meteorology that gave us the very concept of weather “fronts.” A story for another post, but the farewell letter went to the one colleague who understood exactly what Richardson was giving up.
His most cited paper to this day - “Atmospheric Diffusion” (1926), with over a thousand citations - was work he had already completed before the realization. Everything that came after it, he burned.
He walked away from meteorology entirely. He was 39 years old.
And he turned his mathematical mind toward the question that had haunted him since the trenches: Can war be predicted the way weather can?
“Let x Be the Will to Hate”
Richardson approached war the way he had approached the atmosphere - as a physicist. Not with opinions. Not with ideology. With data and equations.
His ambulance unit colleagues remembered him explaining his new research. “Let x be the will to hate,”3 he would say, reducing the most explosive human emotions to a variable in a differential equation. “It beat me!”3 recalled one of his less equation-oriented friends.
Richardson’s arms race model was elegant and disturbing. He set up differential equations governing how nations build weapons, taking into account:
- “War weariness” - how exhausting an arms race is
- “Internationality” - how connected a nation is to others (trade, diplomacy)
- “Preparedness for war” - military spending as a function of economic data
The equations described what people would do if they did not stop and think. That was the point. Richardson didn’t model rational leaders making strategic decisions. He modeled the underlying currents - the political eddies - that push nations toward or away from conflict, whether any individual intends it or not (Richardson, 1939; MacTutor).
Just like the atmosphere.
“Counting Is an Antiseptic Against Prejudice”
Richardson’s second great project was even more ambitious. He wanted to count every single violent death caused by human conflict, from 1820 onwards.
He called them “deadly quarrels” - any conflict in which one person’s death was deliberately caused by another. From a single murder to a world war. (The resulting book, Statistics of Deadly Quarrels, was published posthumously in 1960, seven years after Richardson’s death, edited by Quincy Wright and C. C. Lienau.)
And he organized them the way a geologist organizes earthquakes: on a logarithmic scale.
- Magnitude 0: A single murder (10^0 = 1 death)
- Magnitude 1: A small riot (~10 deaths)
- Magnitude 2: A larger conflict (~100 deaths)
- Magnitude 5: A major war (~100,000 deaths)
- Magnitude 7: A world war (~10,000,000 deaths)
His philosophy, as David Berreby put it in Nautilus, was that “counting is an antiseptic against prejudice.”3 Richardson deliberately ignored who was a “terrorist” and who was a “freedom fighter.” He ignored whether a military action was “justified.” He ignored ideology entirely.
He simply counted the dead.
For two decades before his death in 1953, Richardson painstakingly collected data on every conflict he could find. “He was all the time compiling statistics about conflicts around the world,” recalled his great-nephew Lord Julian Hunt. “Letters would keep pouring in from friends and colleagues and relatives. He had these deep ideas, but he was all the time looking at data.”3
Wars and Earthquakes
And then the data spoke.
When Richardson plotted the frequency of wars against the number of deaths each produced, a pattern emerged. A pattern he recognized instantly from his work on turbulence.
A power law.
Just as atmospheric turbulence follows a power law - many small eddies, fewer large ones, a handful of enormous storms - so does human violence. Many small deadly quarrels, fewer large wars, and a very small number of world-shattering catastrophes.
Richardson found that for each tenfold increase in severity, the frequency of conflicts decreased by somewhat less than a factor of three. The exact same kind of relationship he had seen in turbulent diffusion (Berreby, 2014; Gleditsch, 2020).
This was deeply unsettling. Because the power law meant that giant wars were not freakish, unpredictable outliers - unique events caused by uniquely evil leaders or uniquely unfortunate circumstances. They were statistically inevitable. Rare, yes. But as predictable, in the aggregate, as giant earthquakes.
As Richardson put it in Statistics of Deadly Quarrels: “What has happened often is likely to happen again, whether we wish it or not”.5
The political eddies in the international atmosphere followed the same mathematics as the physical eddies in the real one.
The Turbulence We Live In
Richardson saw the connection that most people miss. We experience political turbulence the same way a fish experiences ocean turbulence - from the inside, we see only local events. A skirmish here. A treaty there. An assassination. An armistice. What Richardson called “the eddying view of a wind.”5
But if you step back - if you plot the data, apply the math, and look at the whole system - you see the cascade. Big whirls of geopolitical power feeding energy into smaller conflicts, which cascade down to individual acts of violence.
As David Berreby wrote, closing his account of Richardson’s life: “War, Richardson taught us, can be as out of our control as a summer thunderstorm. The least we might do is check the forecast.”3
From Dandelion Seeds to Flight Safety to World Peace
So let me tie this back to where we started.
A man watched smoke rise and dandelion seeds drift on a Scottish hillside. He asked: can I predict when the air will tear itself apart? He found a number - a ratio of heat to wind - and the answer was yes.
Then the same man watched nations arm themselves and send young men to die in trenches. He asked: can I predict when civilization will tear itself apart? He found the same patterns - the same cascades, the same power laws, the same mathematics.
Today, the Richardson number keeps pilots safe at 35,000 feet. His arms race equations are still taught in international relations courses. His logarithmic scale for deadly quarrels was one of the first quantitative approaches to peace research - the foundation of a field that now spans hundreds of institutes worldwide (Gleditsch, 2020).
And his poem about whirls is still, after more than a century, the most beautiful two-sentence summary of turbulence ever written.
Richardson died quietly in his sleep on September 30, 1953, in Kilmun, Scotland. One year before the first operational computer weather forecast. He never saw either of his dreams come true - neither the numerical weather prediction nor the mathematical science of peace.
But both are running, right now, as you read this.
Footnotes
References
- Richardson, L. F. (1920). The Supply of Energy from and to Atmospheric Eddies. Proc. Roy. Soc. London A, 97, 354-373. DOI / ADS
- Richardson, L. F. (1922). Weather Prediction by Numerical Process. Cambridge University Press. Internet Archive
- Richardson, L. F. (1939). Generalized Foreign Politics. Cambridge University Press.
- Richardson, L. F. (1948). Variation of the frequency of fatal quarrels with magnitude. JASA, 43(244), 523-546. JSTOR
- Richardson, L. F. (1960). Arms and Insecurity. Ed. N. Rashevsky & E. Trucco. Boxwood Press.
- Richardson, L. F. (1960). Statistics of Deadly Quarrels. Ed. Q. Wright & C. C. Lienau. Boxwood Press.
- Gold, E. (1954). Lewis Fry Richardson, 1881-1953. Biog. Memoirs FRS, 9, 217-235. Royal Society
- Hayes, B. (2001). The Weatherman. American Scientist, 89(1), 10. DOI
- Vulpiani, A. (2014). Lewis Fry Richardson: scientist, visionary and pacifist. Lett Mat Int, 2, 121-128. Springer
- Berreby, D. (2014). Cloudy With a Chance of War. Nautilus, Issue 15. nautil.us
- Gleditsch, N. P., ed. (2020). Lewis Fry Richardson: His Intellectual Legacy and Influence in the Social Sciences. Springer. Open Access CC BY 4.0
- Clauset, A. (2018). Trends and fluctuations in the severity of interstate wars. Science Advances, 4(2). DOI
- SKYbrary Aviation Safety. Richardson Number
- NOAA Aviation Weather Center. Graphical Turbulence Guidance
- Miles, J. W. (1961). On the stability of heterogeneous shear flows. J. Fluid Mech., 10, 496-508. DOI
- MacTutor History of Mathematics. Lewis Fry Richardson
Current status:
- The air: Turbulent as always.
- The Richardson number on my last flight: I didn’t check, but I probably should have.
- The deadly quarrels: Still counting. Still hoping the forecast improves.
Yours Truly
-
Richardson, L. F. (1922). Weather Prediction by Numerical Process. Cambridge University Press, p. 66. Internet Archive. ↩
-
Hayes, B. (2001). The Weatherman. American Scientist, 89(1), 10. DOI. ↩
-
Berreby, D. (2014). Cloudy With a Chance of War. Nautilus, Issue 15. nautil.us. ↩ ↩2 ↩3 ↩4 ↩5 ↩6 ↩7
-
Gleditsch, N. P., ed. (2020). Lewis Fry Richardson: His Intellectual Legacy and Influence in the Social Sciences. Springer. Open Access CC BY 4.0. ↩
-
Richardson, L. F. (1960). Statistics of Deadly Quarrels. Ed. Q. Wright & C. C. Lienau. Boxwood Press. ↩ ↩2